Plot a graphics of tree rings
Lplot(L, rn = 1:length(L), col = "red", ...)Arguments
Value
No return value, only draw tree ring plot.
Examples
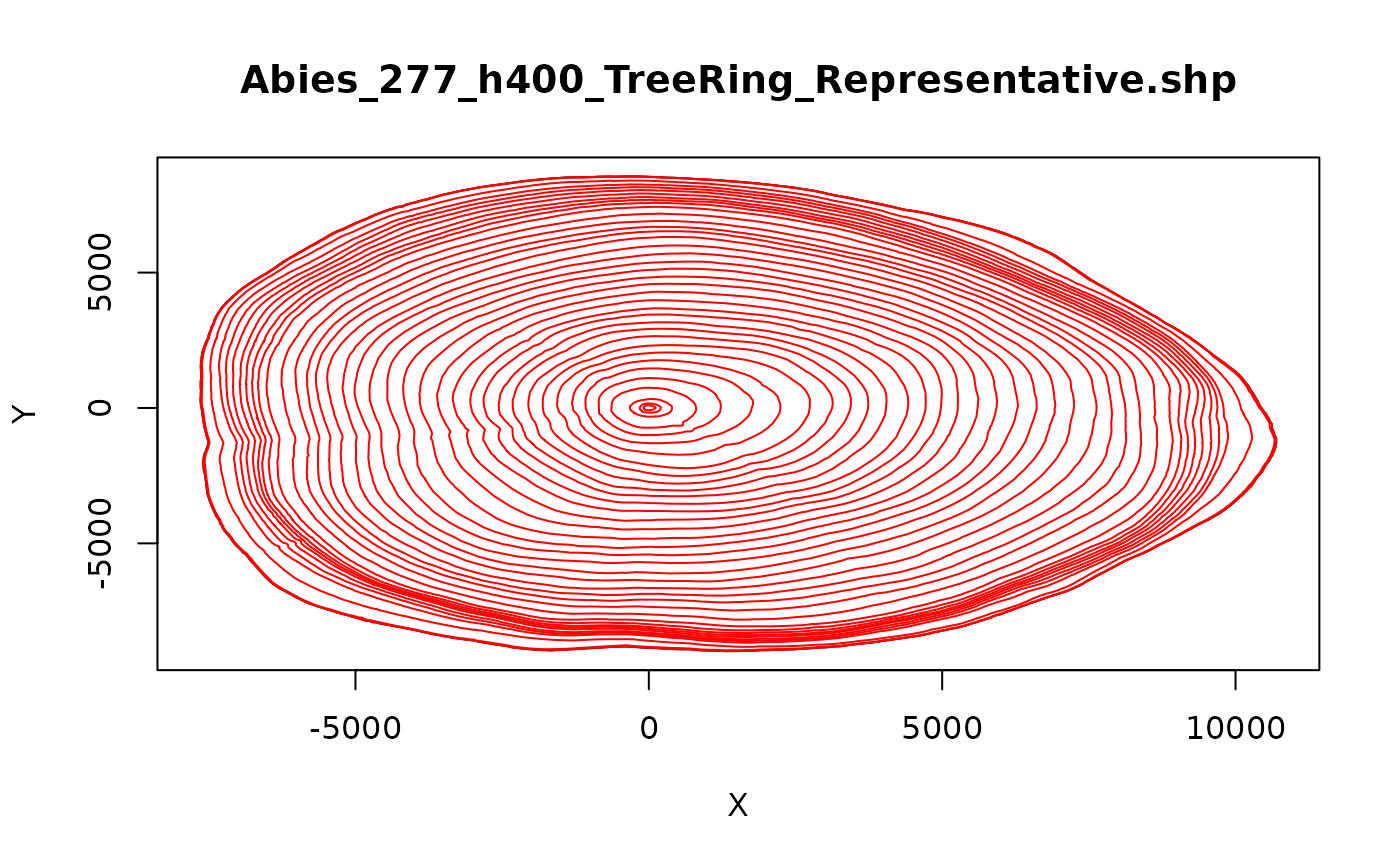
Lplot(TR@L,main=TR@L_filename)

Lplot(TR@L,rn=1:20,col='blue',main=TR@L_filename)

Plot a graphics of tree rings
Lplot(L, rn = 1:length(L), col = "red", ...)No return value, only draw tree ring plot.
Lplot(TR@L,main=TR@L_filename)
Lplot(TR@L,rn=1:20,col='blue',main=TR@L_filename)