Draw a plot of tree rings This function draws Tree rings of a disk from x, y list(x,y) with name of year.
Source:R/plot.R
plot_TreeRing.RdDraw a plot of tree rings This function draws Tree rings of a disk from x, y list(x,y) with name of year.
plot_TreeRing(L, year = 0, ...)Arguments
Value
No return value, only draw tree ring plot.
Examples
names(TR@L)
#> [1] "0" "1" "10" "23" "28" "33" "38" "43" "48" "53" "58" "63"
#> [13] "68" "73" "78" "83" "88" "93" "98" "103" "108" "113" "118" "123"
#> [25] "128" "133" "138" "143" "148" "153" "158" "163" "168" "173" "178" "183"
#> [37] "184" "185"
plot_TreeRing(TR@L)
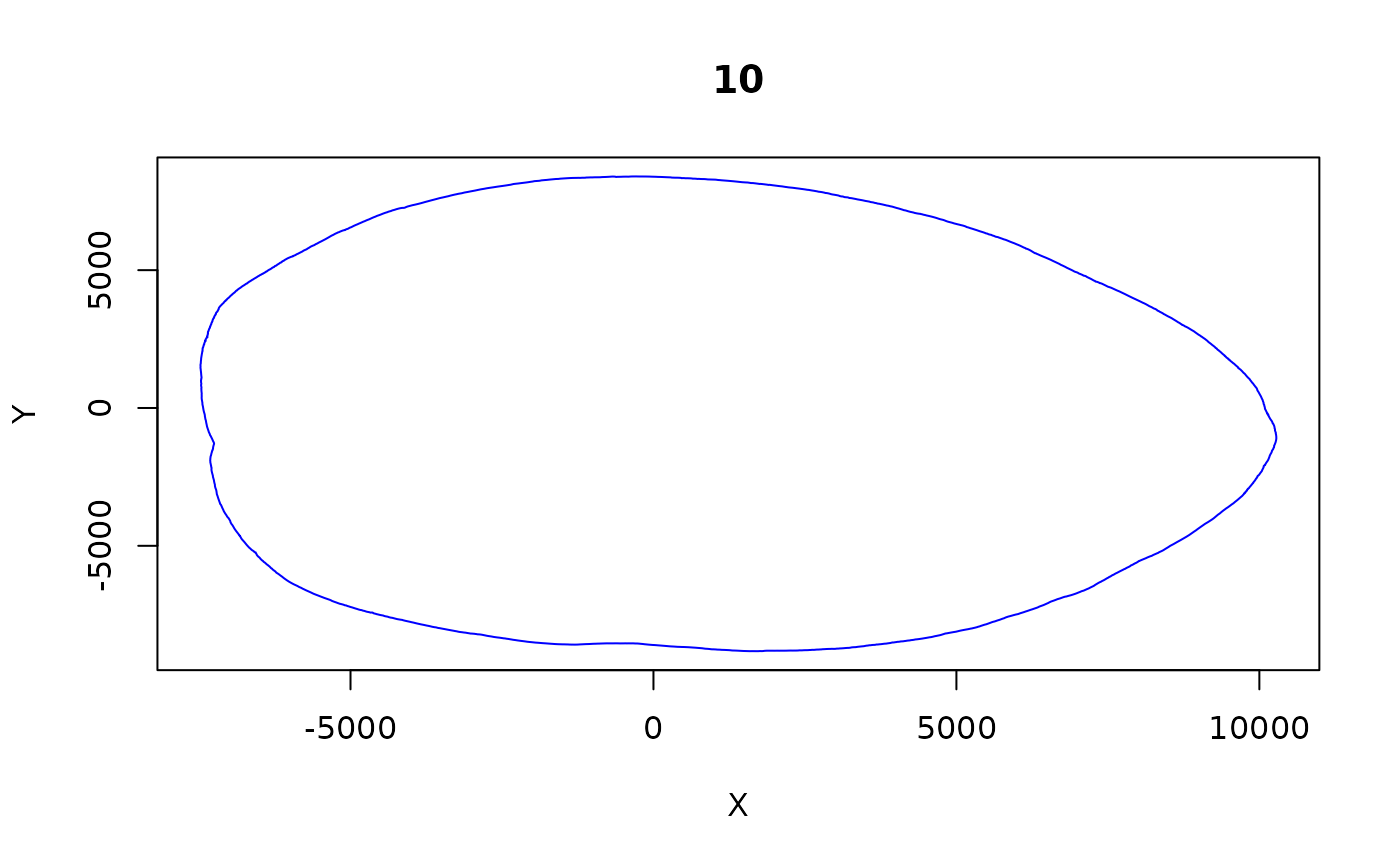
 plot_TreeRing(TR@L,year=10,type='l',col='blue')