報告書用作図 総合優占度経年変化 Figure of chronosequence for dominant variance
Source:R/TateyamaVegetationAnalysis.R
Fig_DominanceValue.Rd報告書用作図 総合優占度経年変化 Figure of chronosequence for dominant variance
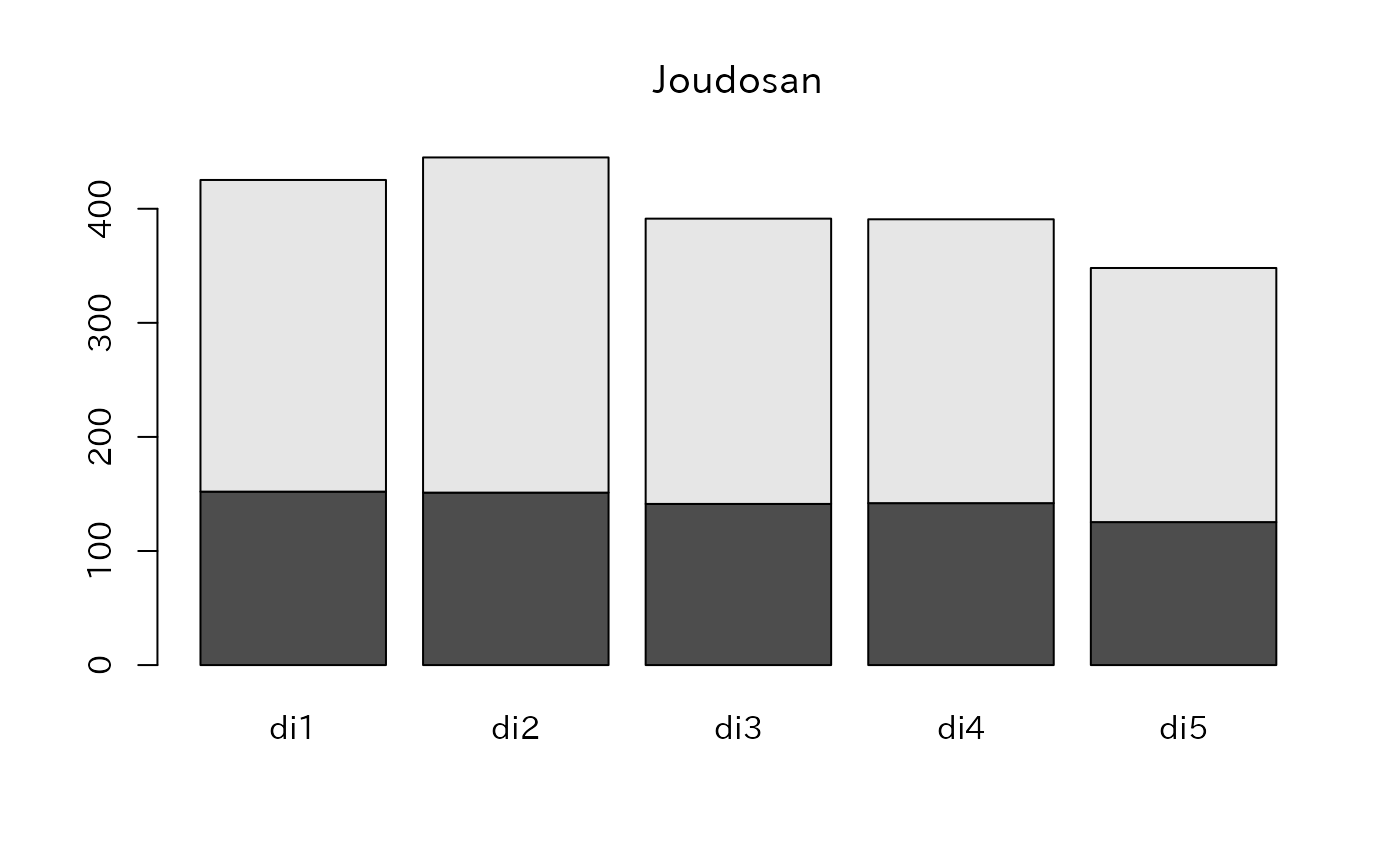
Fig_DominanceValue(plot_name = "Joudosan", vc_repo = VCrepo)Examples
library(dplyr)
#>
#> Attaching package: ‘dplyr’
#> The following objects are masked from ‘package:stats’:
#>
#> filter, lag
#> The following objects are masked from ‘package:base’:
#>
#> intersect, setdiff, setequal, union
library(ggrepel)
#> Loading required package: ggplot2
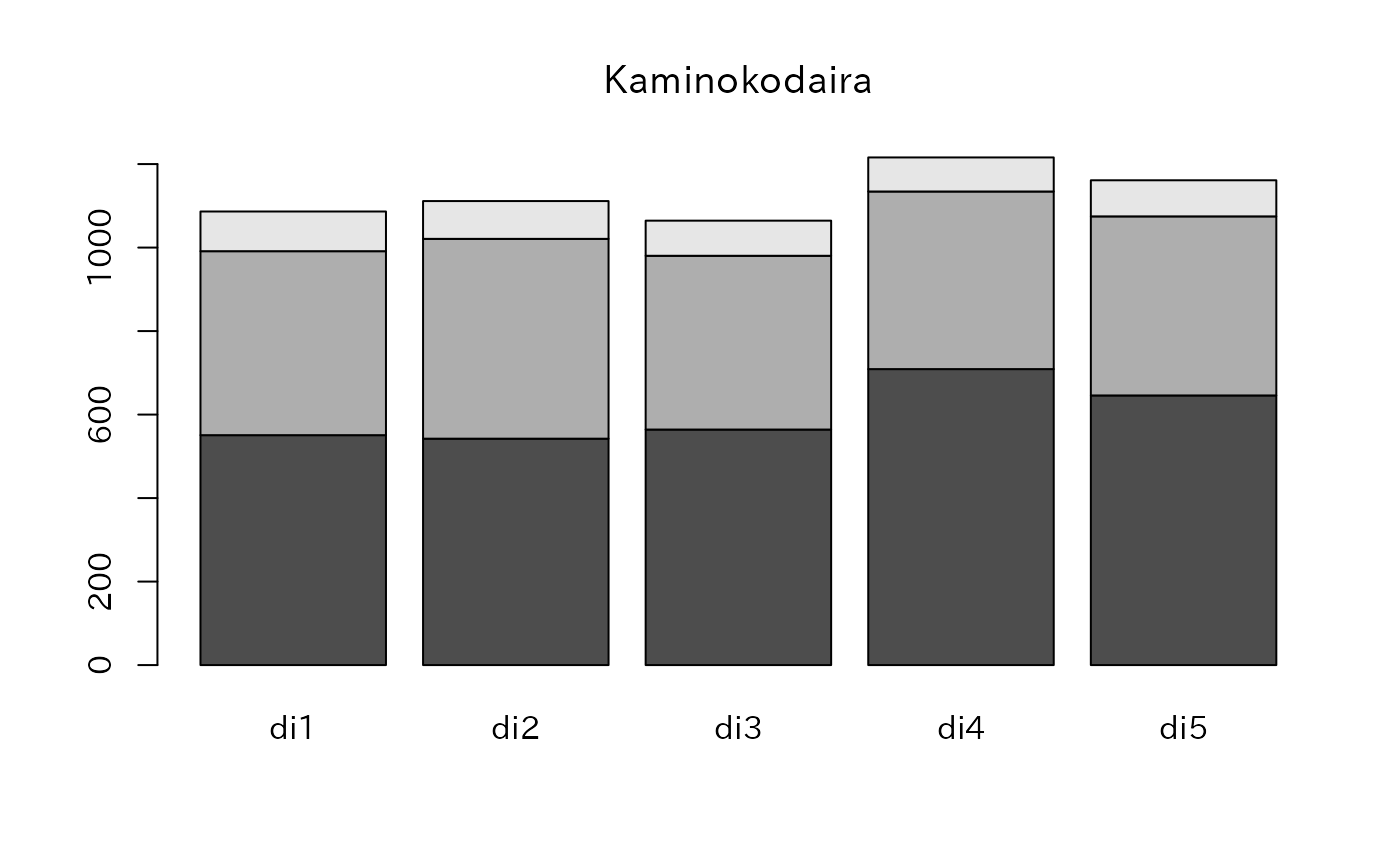
Fig_DominanceValue("Kaminokodaira")
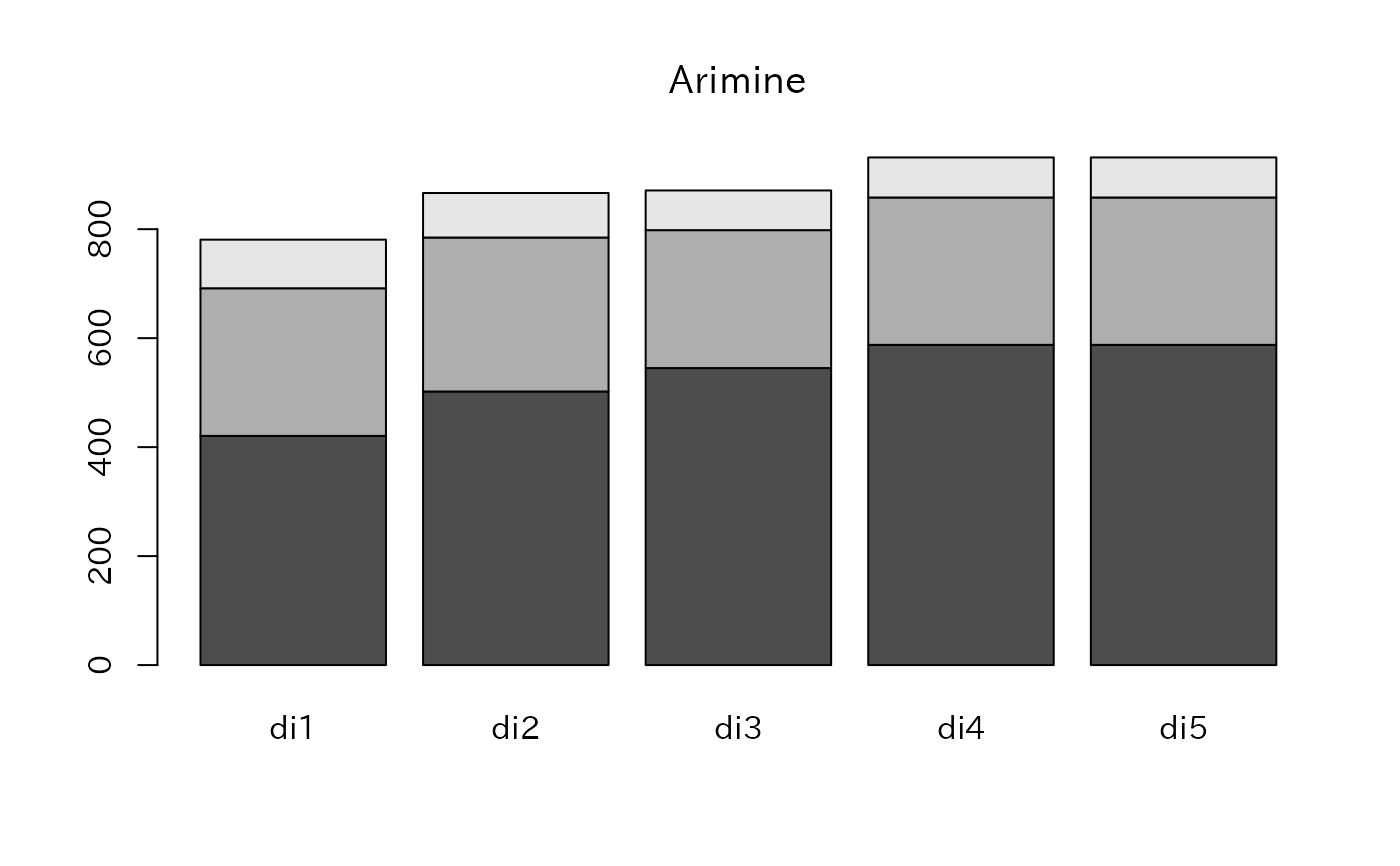
 Fig_DominanceValue("Arimine")
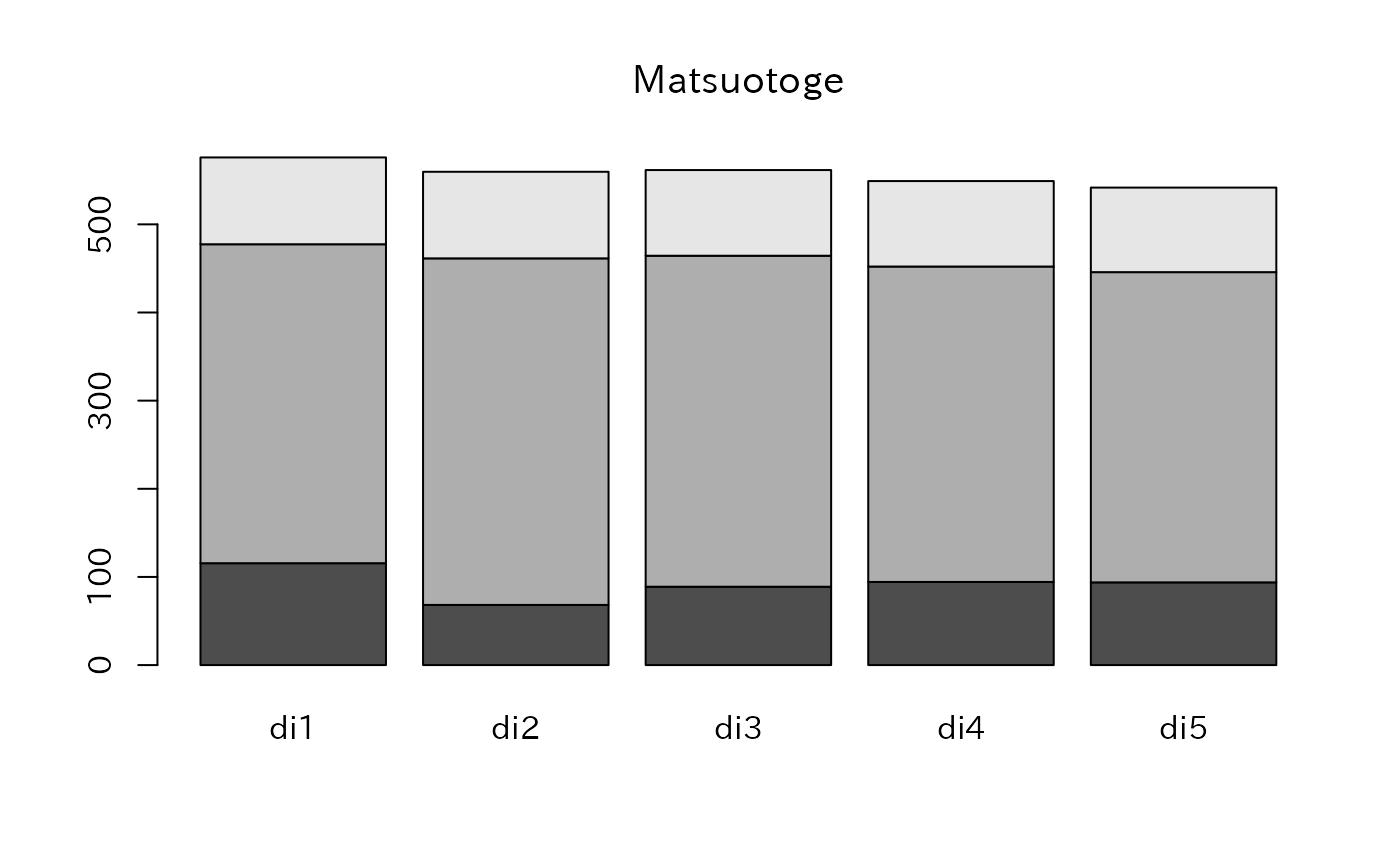
 Fig_DominanceValue("Matsuotoge")
 Fig_DominanceValue(plt$plot_name[9])
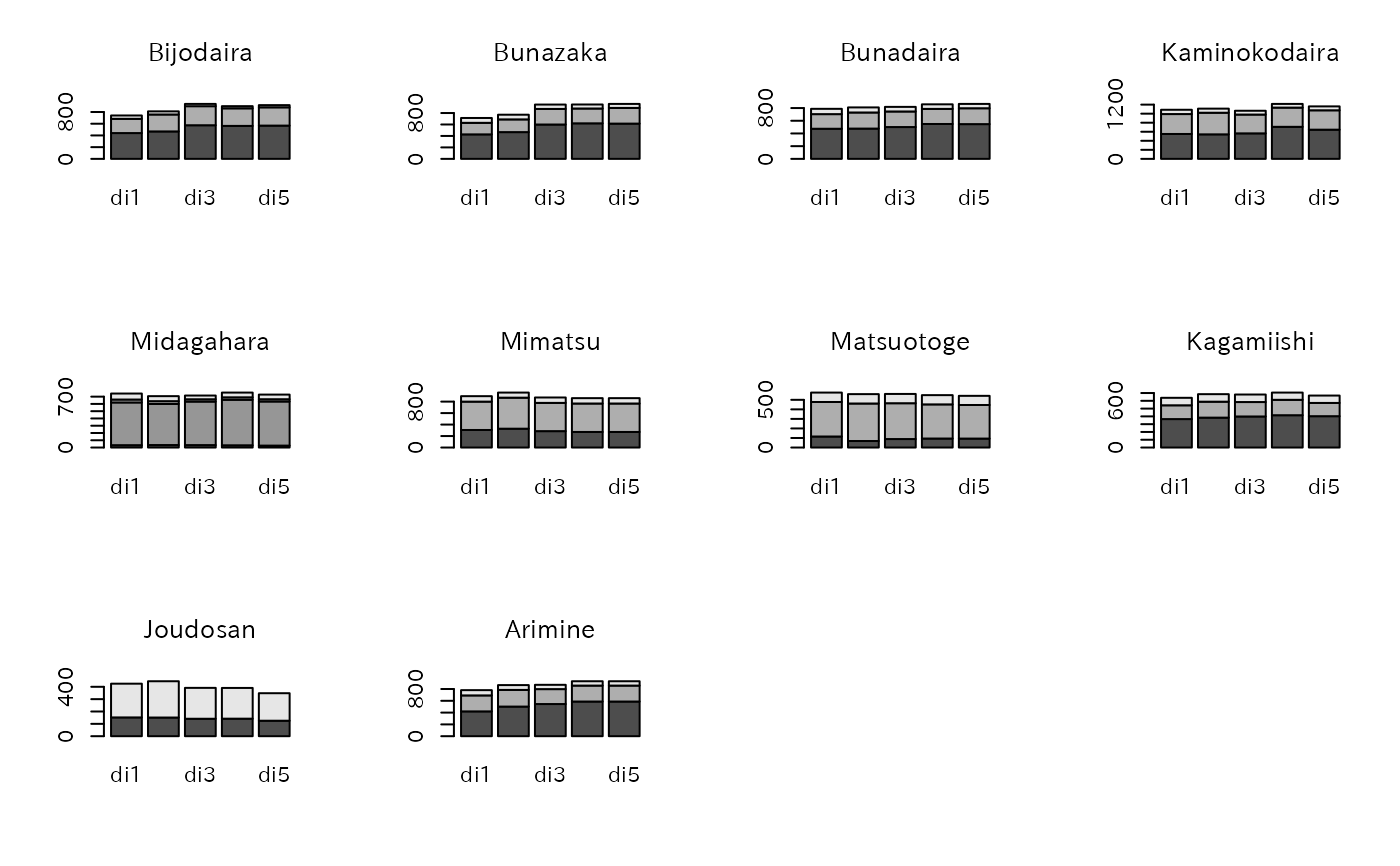
 par(mfrow=c(3,4))
for(i in plt$plot_name)Fig_DominanceValue(i)
par(mfrow=c(1,1))
par(mfrow=c(3,4))
for(i in plt$plot_name)Fig_DominanceValue(i)
par(mfrow=c(1,1))
 # 単年度版
Fig_DominanceValue(plot_name="Arimine",vc_repo=VCrepo)
# 単年度版
Fig_DominanceValue(plot_name="Arimine",vc_repo=VCrepo)