各調査区におけるサブプロット位置 plotで描画したキャンバスにtextで上書きするコマンド
subplot_xy_text(plot.name = "Mimatsu", ...)Examples
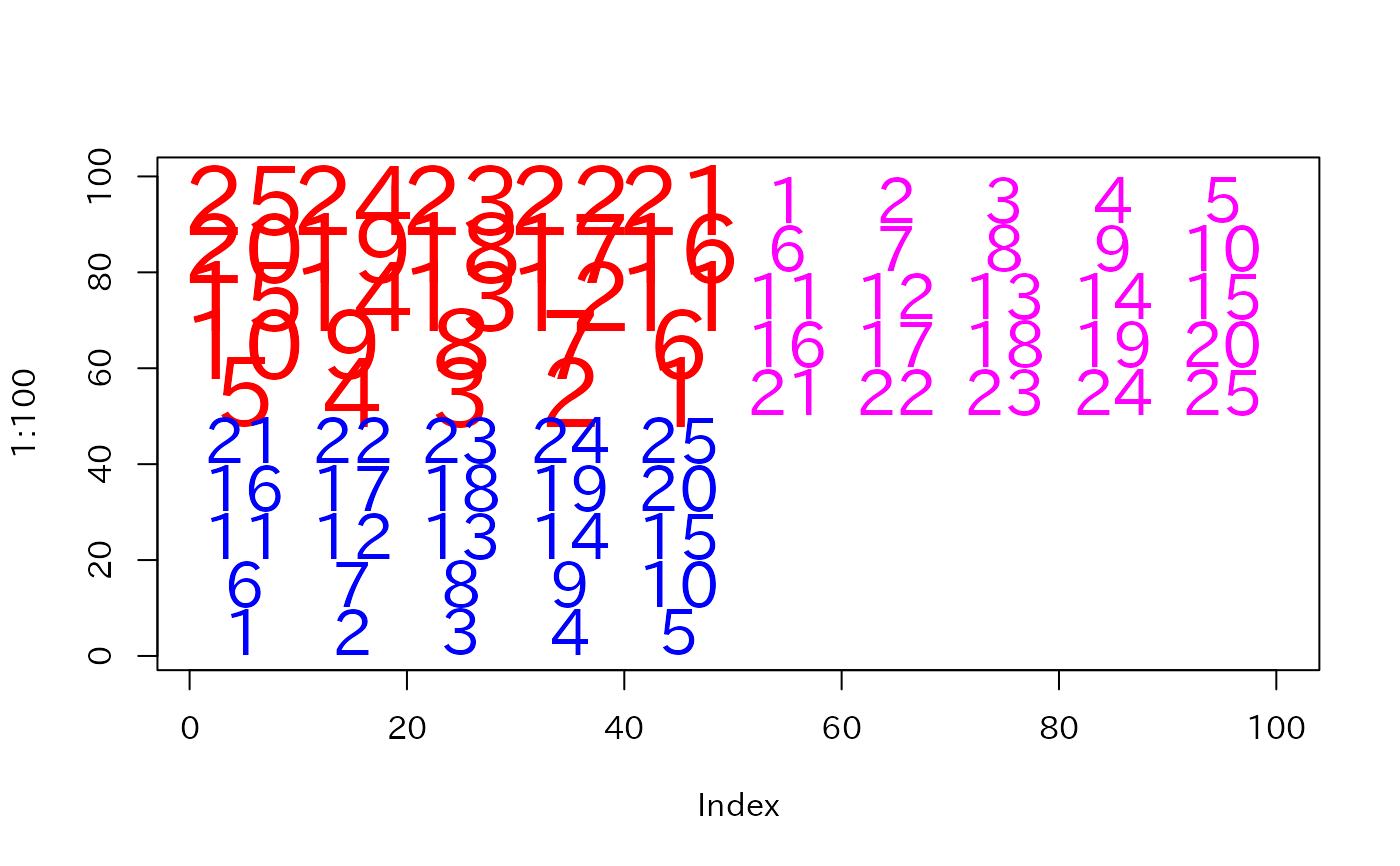
plot(1:100,type="n")
subplot_xy_text(plot.name="Mimatsu",col="red",cex=3)
subplot_xy_text(plot.name="Arimine",col="Blue",cex=2)
subplot_xy_text(plot.name="Kaminokodaira",col="Magenta",cex=2)